Article: Quality Beer Design
At Prism, we like to think that we're "glass half full" kind of people. We're especially happy when our glass is half full of beer, and happier still when that beer has been poured to perfection. What makes a perfect pint? Read on to find out.
Written by Andrew Macpherson, Managing Director, and Dr. Paul Nelson, Technical Director.
We often deliver training courses in Design of Experiments (DoE), so it seemed sensible to apply that knowledge to an area of personal interest! If you'd like any information on the basics of DoE, please get in touch with us.
Defining the Problem
Everyone has their own opinions on how to pour the perfect pint, with an endless list of theories and things that might affect it: type of beer, beer container (bottle, can or hand pump), angle of the glass, speed at which the beer is poured, type of glass used, temperature of the beer etc.
We also had many lively debates about what constitutes the "perfect pint", and in the line of duty often found ourselves having to conduct further research in the local pubs. We agreed on two simple responses that we felt would be good measures of how well a beer has been poured: the height of the head, and the amount of time before the beer goes flat.
Choosing a Design
We eventually settled on four factors to investigate, and some ranges to test them over. We'd conducted similar studies in the past, so were reasonably confident that we had picked a sensible design space.
|
Factor |
Name |
Type |
Units |
Low Setting |
High Setting |
|---|---|---|---|---|---|
|
A |
Dispense Time |
Numeric |
seconds |
15 |
30 |
|
B |
Glass Angle |
Numeric |
degrees |
45 |
90 |
|
C |
Pour Height |
Numeric |
mm |
0 |
150 |
|
D |
Beer Type |
Categoric |
Premium |
Value |
Given our previous work, we decided to try and optimise our responses within our chosen design space; this led us to choose a face-centred Central Composite Design, with two Centre Points per Beer Type. We used the Design-Expert software package to create the design, which ended up consisting of 32 experiments.
Experimental Setup
After choosing our four factors to experiment upon, we looked at how we could minimise the impact of any other environmental factors (ideally we'd have performed the experiments in a climate-controlled laboratory, but we had to make do with our office instead).
|
Factor |
Control |
|---|---|
|
Beer Container |
Use cans of beer for all experiments |
|
Beer Temperature |
Refrigerate all beer cans overnight, leave in fridge until experiment is about to be performed |
|
Ambient Temperature |
Set office air conditioning to 15°C |
|
Glass Type |
Use identical single-use plastic glasses |
|
Operator |
Use a single operator to pour all the beers |
As we were performing a number of experiments we randomised the run order, to ensure that we didn't accidentally introduce any systematic bias into our results.
We devised a way of pouring a beer under relatively controlled conditions: we first positioned the pint glass on an adjustable arm, allowing us to precisely control the glass angle (we actually used one of our catapults for this, which have featured in a number of our previous DoE courses). We then measured up from the edge of the glass to determine the height that the beer should be poured from. Finally, we took the relevant beer can (Premium or Value) from the fridge and began pouring; the pour duration was carefully timed, with the beer pourer given a countdown to ensure the drink was poured at a consistent rate. We poured 300ml for each experiment, which left plenty of room in the glass for the more "lively" pints!
As soon as the beer was poured we carefully placed it on a flat table and measured the height of the head. At the same time, we started a stopwatch to record the "retention time" (the amount of time before it was possible to see the beer through the head from above).
Once we'd run all 32 experiments we fed the results into Design-Expert and began our analysis. For both responses we initially fitted a quadratic model, then used the software's backward elimination method to remove any terms that did not contribute to the model.
Analysis Summary: Head Height
We began the analysis without transforming the response data, but the diagnostic plots indicated that a square root transformation would give more consistent variation across the design space. After applying this, we reviewed the Analysis of Variance (ANOVA) table to see which effects were having a significant effect on Head Height. We found that all four main effects were strongly statistically significant, with p-values less than 0.001. Two interaction terms were also significant: Dispense Time x Pour Height, and Glass Angle x Beer Type. This means that, for example, the two Beer Types did not behave in the same manner when the Glass Angle was varied. Finally, the B2 term also appeared, meaning that there was significant curvature in the model due to the Glass Angle.
It's often easier to interpret pictures than tables though, so we moved on to review the Model Graphs.
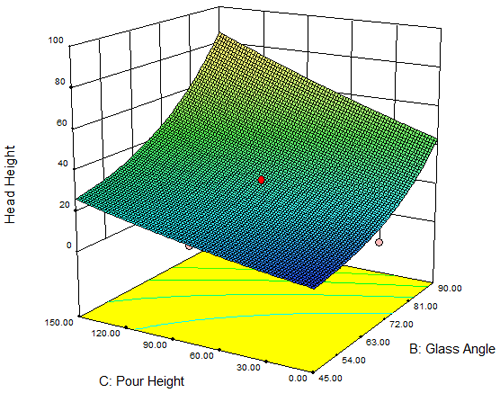
This chart shows that there's one combination of factors that would result in a very large head: a Glass Angle of 90° and Pour Height of 150mm would give a Head Height of over 80mm! Ideally we'd want a Head Height of around 20mm, so we can use this graph to find a combination of factor settings to achieve this.
The curvature due to Glass Angle is also clear to see on this chart.
Analysis Summary: Retention Time
Again, we started with no transformation but followed the diagnostic plots' recommendation to apply a square root transformation to the response data. Reviewing the ANOVA table shows that three main effects were significant; the one factor that did not have an effect was Dispense Time. The interaction between Glass Angle and Beer Type was significant, as with the Head Height response. Also, we saw that there was some curvature due to Pour Height. We then went on to look at the Model Graphs to get a better understanding of the model.
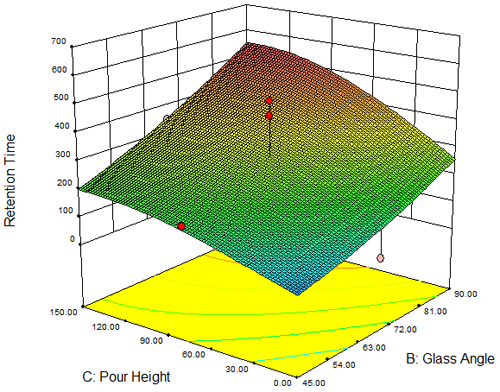
As with Head Height, the combination of Glass Angle = 90° and Pour Height = 150mm gives our highest response value. For Head Height this was far too high, but in this case it's a good thing as we want to maximise Retention Time – we don't want our beer to go flat before we've had a chance to drink it!
Thinking about this in real terms, if we pour beer from a great height straight into the bottom of the glass (i.e. we don't tip the glass as we pour), then we're going to get a lot of head and not much beer! The sheer quantity of foam will take a long time to bubble away, which is why we're seeing high values for Head Height and Retention Time in that particular part of our design space.
We can see that we have a bit of a balancing act to perform here: we want a Head Height around 20mm and as long a Retention Time as possible. We could study both graphs to try and find some factor settings that meet both criteria, or we could let the software do the hard work for us!
The Secret to the Perfect Pint!
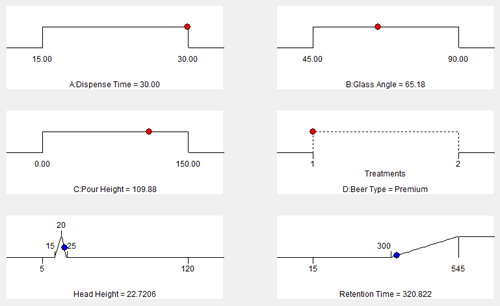
Using the Numerical and Graphical Optimisation tools, we entered a target of 20mm for Head Height (with the range 15-25mm) and we decided to maximise Retention Time to ensure it is at least 300 seconds (5 minutes). The software found a number of solutions for us, the most desirable being the following:
Our specified limits for the two responses gave us an operating region that satisfied both:
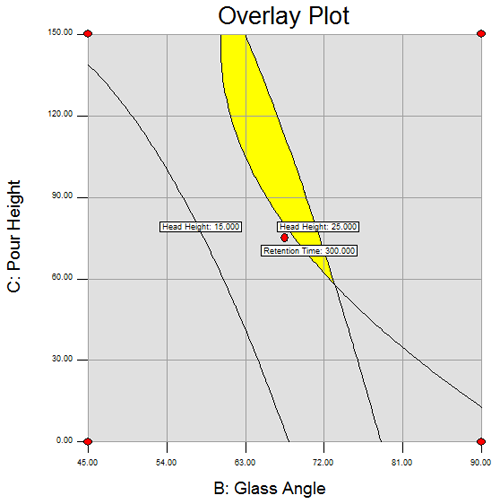
The software actually gave us 10 solutions that resulted in a perfect pint, all of which required the Premium ale. While we could achieve our desired Head Height quite easily with the Value lager, we found that the Retention Time was much better with the ale.
All the solutions had a Dispense Time of 30 seconds, as pouring the pints more slowly gave us a more robust region in terms of Head Height. The Glass Angle varied slightly, but was always in the centre of our design space (around 67.5°). Finally, the Pour Height for all solutions was approximately 110mm.
These factor settings resulted in a Head Height of around 23mm and a Retention Time of around 320 seconds.
We performed these experiments to the best of our ability, but we'd strongly encourage you to run some verification experiments of your own! Cheers!
Be the first to know about new blogs, upcoming courses, events, news and offers by joining our mailing list here.