
Article: Superheroes PCA
Prism's Technical Director Paul 'Silver Surfer' Nelson combines three of his favourite geeky past-times: 1. Top Trumps, 2. Superheroes and the villains who shaped 'em, and 3. the power of graphs, to help improve understanding.
Written by Dr. Paul Nelson, Technical Director.
Have you heard it said ‘A picture is worth a thousand words’? Well, here are two pictures. Do the maths.
Ok, graphs don't always speak for themselves. This is an important observation. It helps to know something about the subject, or at least have enough interest in the subject to do the research needed to establish a frame of reference. Pictures can be powerful in the hands of those who understand what they convey and can interpret them. For example, if you are a chemist or an analytical chemist, like some of our scientific consultants, then pictures relating solvents, reagents and other chemical ingredients, rather than say supers, are more likely to get your spidey senses tingling.
Having combined my childhood affection for Top Trumps with my affliction for supers and statistics*, I created (ok, my daughter was paid good pocket money to create) a collated data table**. This is a rogue’s gallery of 58 characters together with 8 characteristics describing their powers, abilities and skills. My solitary experience of supers taught me that some characters are quite similar, per their characteristics and abilities, while others are quite different. No doubt, from this premise high performing teams of supers were created, such as the Justice Leagues, Fantastic Four, X-men and my favourite team of misfits, Watchmen.
The idea of building a team of supers suited to specific tasks took seed. I have bounced this idea around with colleagues and clients (read: bored the super hero pants off them): which supers would you select to make up probably the best 5-a-side football team (basketball team for our friends in the U.S.A.)? Off the top of your head, or from a set of top trump cards, this is likely to be impossible when you know little about supers; even for another handpicked team – the IMF (impossible missions force and not the International Monetary Fund). Even when the data has been pooled together from several different places (top trump cards, websites etc.), the task is not made easier. What about displaying and conveying the information contained within the data table in pictures?
Data in and of itself is not information. It is challenging to see patterns and relationships in a table full of numbers. A great man once told me "If you want to hide something from the reader, put it in a data table. If you want to bury something, put it in a data table in an appendix. However, if you want to convey something, put it in a graph." However, visualising the characteristics of characters, or the physico-chemical properties of solvents captured in 6, 7, 8 or more dimensions isn’t easy. Our brains can cope with 2 or 3 dimensions. But don't despair; even supers rely on science to cope. Just ask Peter Parker, or Tony Stark.
Taking direction from the latter’s alter ego, Iron Man's tag line "When man and machine combine a hero is born"... lets combine our human visual skills with the PCA data reduction and visualisation technique. PCA uses the correlations that exist between the supers’ characteristics to compress or project an 8-D scatter on to one comprising only a few relevant axes or components (linear combinations of the original variables) that describe the major relationships and patterns in the data. These principal component maps and the information they contain, in the form of their corresponding navigational loadings plots, can then be displayed in two or three dimensional scatter plots, like the ones you see above. These plots provide a simplified, but reasonably comprehensive interpretation even for the super-hero uninitiated.
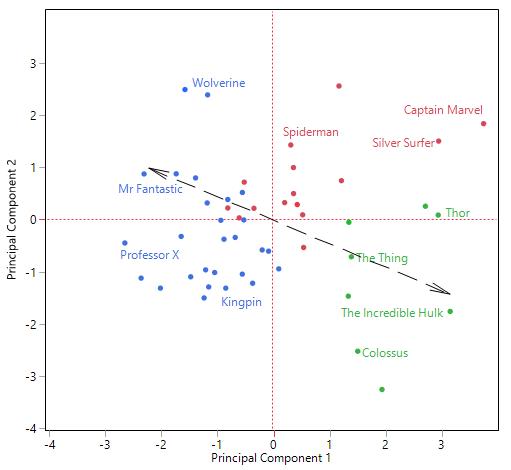
Now let us look for patterns. The first 2-D principal component map representing the supers allows us by eye to quickly establish that characters:
- Close on the map, such as the labelled Colossus and Hulk, who, as their names imply, are likely to have similar attributes and abilities (i.e., Big and Strong),
- While those diagonally opposed, such as the rock-like; super-strong; short-fused impetuous member of the Fantastic Four, The Thing, and his flexible, pragmatic and thoughtful leader Mr. Fantastic, are likely to be worlds apart.
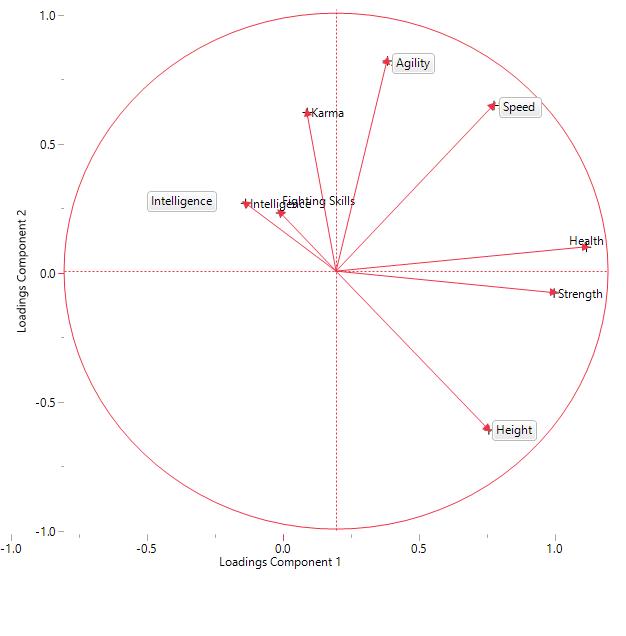
The second 2-D loadings plot displays the relationships between the many corresponding measured characteristics and acts as a navigational aid to help you find your way around the component map. For instance, characters in the bottom right hand corner of the components map possess super-strength, height and endurance, while characters to the left of the plot are intelligent geniuses with good Karma.
These two plots provide a visual way of helping us to identify ideal characters for our football or basketball teams based on their characteristics and abilities. Which character would you pick to manage, or lead a team and which one would you pick to strike fear into the opposition? For a thorough explanation of how the same tool can be used to map and select ingredients for chemistry based on their physical-chemical properties check out the book by Rolf and Johan Carlson "Design and Optimization in Organic Synthesis: Revised and enlarged edition".
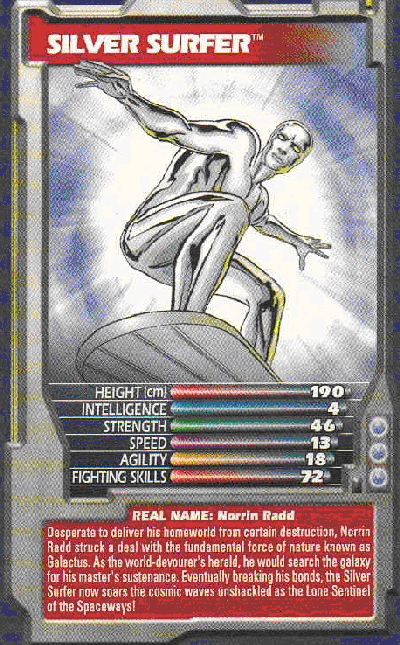
As a geek, I can't resist letting you know that my favourite character is The Silver Surfer. In JMP, you can hover over a character, or a data point, to see their information (including an image). The Silver Surfer’s superhuman strength, stamina and durability (health) help him to navigate through interstellar space, dimensional barriers, exceeding the speed of light on his super-cool surf board. However, his was a life of servitude rather than leadership. Note, he is the direct opposite to the world's most intelligent telepathic, Professor X, who can read, control and influence minds.
Which super is most like you? According to the Superhero quiz website, I’m most like Spider-man. Cool. PCA. C'mon use it. Don't make me angry. You wouldn't like me when I'm angry. No that’s the big green guy. Not the Goblin, he’s small and mean.
*If you are unfortunate enough to be cornered by me at a party and feel compelled to reply to my opening gambit "Hi, I'm a statistician and which superhero is most like you?" simply visit The Superhero Quiz (external site; opens in new browser tab).
**This data table appears to have been added to by other geeks like me.
If you want to produce a principal component map made up of your own team at work, then please contact us. We provide a set of simple personality questions, which will help you to picture and compare your sensitive technical folks, from their bold expressive counterparts! We've also developed an online PCA 3D visualiser - it's free to use so give it a whirl!
Be the first to know about new blogs, upcoming courses, events, news and offers by joining our mailing list here.