
Article: Statistical Design for Precision and Method or Technology Transfer studies
This second article in a series exploring statistical methodology involved with precision and method or technology transfers focusses on nested or hierarchical designs.
Written by Dr. Paul Nelson, Technical Director.
“Measure what is measurable and make measurable what is not” ~ Galileo Galilei
In our previous article, we began by exploring the underappreciated distinction between a difference and an equivalence statistical approach. When looking for evidence of equivalence or reproducibility between sites, it is necessary to demonstrate that any differences or variations between the sites are due to genuine non-equivalence rather than variations attributable to local or intra-site variation. It is therefore necessary to choose a design which captures and measures or estimates the influence of separate factors or components of inter- and intra-site variation to compare them.
The most commonly used, simple, effective, efficient and intuitive data collection scheme for estimating variance components is called a nested or hierarchical design. This arrangement lends itself to the natural taxonomy of method variation or precision, with steps in the method process being nested within other steps. Whenever a branch occurs at a particularly level in the hierarchy, all sources or operations above that branch are identical.
An example from a method transfer exercise may help. Suppose that a technology transfer of an assay from an originating Research & Development (R&D) site to a receiving Manufacturing Operations site is required to establish the method. To measure or estimate and assess how much variation will be contributed by differences between the two sites relative to having different analysts prepare different samples for repeat injections, the nested data collection scheme in Figure 1 could be employed.
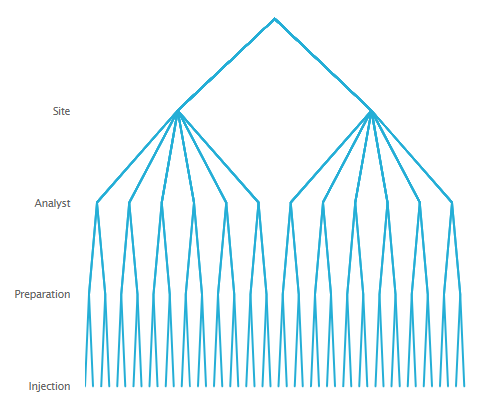
Note that in this illustration, for each site there are six analysts. Each analyst is asked to make two independent preparations of material. From each preparation two injections will be made onto the column. From this nested arrangement, a total of 48 assay results will be generated.
From the above nested arrangement four separate sources or components of variation can be measured or estimated. These are: 1. Variation between the two sites; 2. Variation between the analysts within each site; 3. Variation between preparations prepared by the same analyst; and 4. Variation due to differences between repeat injections of the same preparation. These variance components can all be isolated and measured through the series of branches at each level in the hierarchy of the nested design.
These components of variation can be further grouped into the precision categories: reproducibility, attributable to site-to-site differences; intermediate precision or within-site differences due to analyst and preparation (other intra-laboratory sources could have been included in the study such as instrument, occasion, etc.); and the repeatability of the method injections.
Therefore, a desirable consequence of using a nested design for a TT study, such as the one pictured in Figure 1, is that it will also enable the assessment of all three levels of method precision referred to in regulatory guidelines. Namely again, the reproducibility of the method between sites would additionally provide and use information on the intermediate precision within each site; which will in turn provide information on method repeatability.
It is important to point out that these 48 results are not equivalent with respect to the operations used to obtain them. A common mistake made by many groups is to incorrectly ignore the data structure and sources of variation inherent in the data and simply calculate the average and standard deviation and generate a single relative standard deviation (RSD - standard deviation relative to the mean result) or RSD of all or of subsets of the data set (e.g., by analyst). “The analysis should follow the specifics of the data-analysis plan outlined in the validation protocol.” USP <1033> Biological Assay Validation.
It is also important to note that other designs which involve a crossed or a crossed and nested structure may be more appropriate to reflect the format and management of your method or assay.
Catch up with Part One in this series of statistical articles, or read on as we will discuss the Statistical Analysis of Equivalence Data from Technology Transfer studies in Part Three. We also have a free Nested statistical tool here, allowing you to perform a variance components analysis on your own data - read our How-To: Nested Analysis guide to learn how to use it.
If you require statistical assistance or advice, please click here for more information about our consultancy services.